

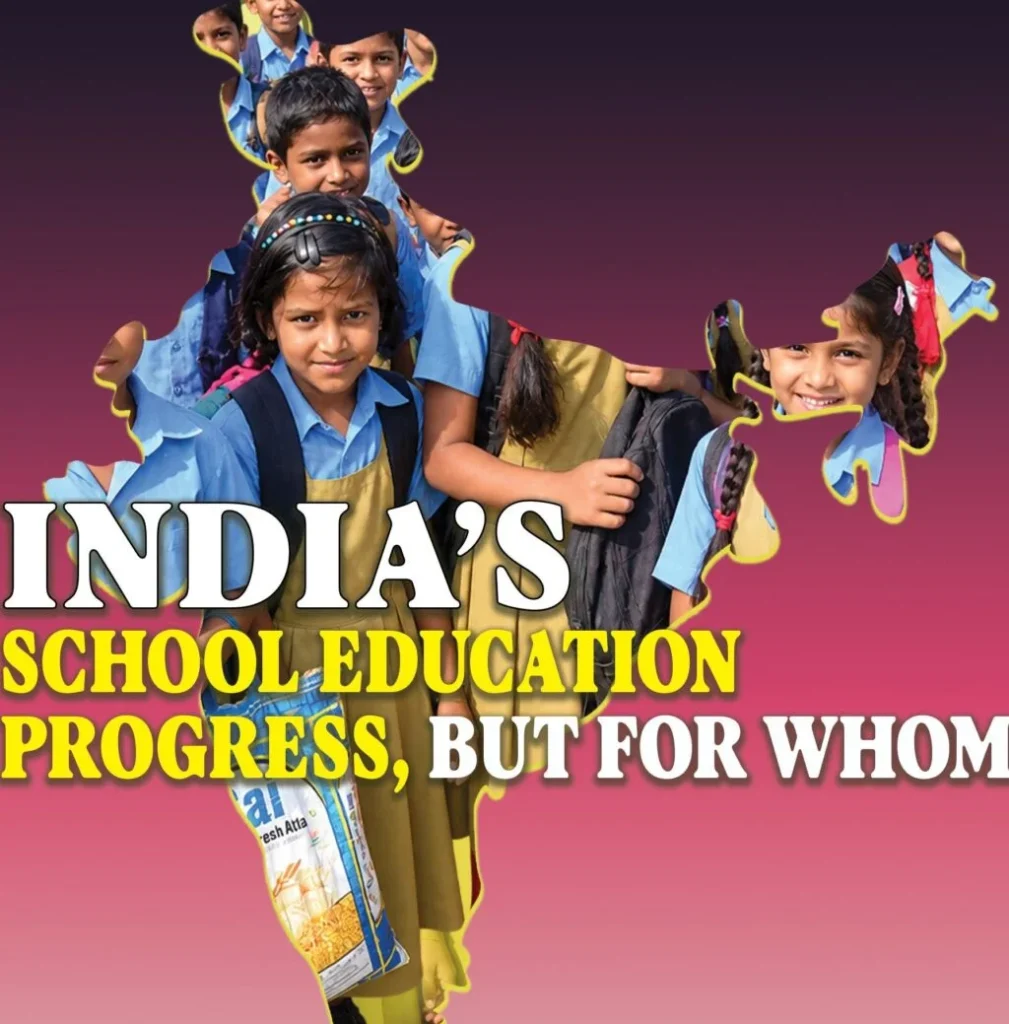
The Union Ministry of Education’s UDISE+ 2025–26 report presents an encouraging picture of Indian school education. The teacher workforce has crossed the one-crore mark, dropout rates have declined, pupil-teacher ratios have improved and basic infrastructure has expanded. Yet a closer reading of the data, alongside independent assessments and the latest policy research, reveals a more complicated reality. India has made substantial progress in expanding schooling, but equity, learning outcomes and the quality of public education remain unfinished challenges.
UDISE+ covers nearly 14.67 lakh schools, 1.03 crore teachers and 24.72 crore students, making it one of the world’s largest education databases. Its findings deserve recognition, but they primarily measure infrastructure, enrolment, staffing and participation. They do not, by themselves, tell us what children are actually learning.
Real Progress, But an Uncomfortable Shift
Positive indicators are significant. The pupil-teacher ratio improved marginally from 25:1 in 2024-25 to 24:1 in 2025-26, while the number of teachers has increased by 8.3% since 2022-23. Dropout rates have fallen to 1.8% at the preparatory, 3.6% at the middle and 7% at the secondary stage. Basic infrastructure has also expanded, with electricity available in about 95% of schools – though how reliably and continuously it is available is another question – and safe drinking water in 99.5%.
But the report contains another, less celebrated statistic: government schools lost nearly 86 lakh students between 2023-24 and 2025-26, while recognised private unaided schools gained more than 88 lakh. Overall enrolment declined by about 8.26 lakh. This is therefore not simply a story of children leaving education. It is also a story of children moving from government to private schools.
The reasons cannot be established from UDISE alone. Demographic change, migration, school rationalisation and parental preferences may all play a part. But the scale of the movement demands investigation. Why are parents increasingly willing to pay for private education when government schools are free?
Independent evidence provides a possible explanation. Research on parental school choice points to perceptions of better teaching, English-medium education and the social image of private schools. Such findings should not be generalised nationally without caution, but they underline an important policy question: improving government-school infrastructure is not enough if parents do not perceive the schools as providing comparable educational opportunities.
The Paradox of 24:1 Ratio
The national pupil-teacher ratio also needs careful interpretation. India still has 1,00,843 single-teacher schools. In such schools, one teacher may have to manage several grades and subjects, limiting individual attention and making a broad curriculum difficult.
This exposes the limitation of national averages. The latest NITI Aayog analysis shows major State-level disparities in staffing, with secondary-stage PTR ranging from 43 in Jharkhand to six in Sikkim.
Thus, the issue is not merely how many teachers India has but where those teachers are available. A favourable national average can conceal serious shortages in particular districts and schools, especially in rural, tribal, hilly and remote areas. In other words, progress in teacher numbers is encouragingbut for which children is that progress actually available?
Falling Dropout, But Only Half Retained
The fall in dropout is unquestionably welcome. Yet another indicator should temper the optimism: secondary-stage retention is only 51.9%, although it improved from 47.2% the previous year. The transition rate to secondary education is 88.3%, compared with 99.2% from foundational to preparatory and 93.8% from preparatory to middle.
The distinction between dropout and retention matters. A lower annual dropout rate does not mean that most children successfully complete secondary education. The sharp vulnerability appears as children move towards higher grades.
State-level disparities are considerable, while UNICEF’s review of Indian evidence indicates that children moving from primary to secondary education face greater risks of entering work or combining schooling with work. This underlines the importance of linking educational policy with poverty reduction, social protection and measures addressing child labour.
The policy challenge, therefore, is no longer merely to put children into school. It is to keep them there through adolescence. Progress in enrolment and dropout figures has limited meaning if a large proportion of children do not complete secondary education.
Better Schools, But Are Children Learning?
This is where UDISE+ needs to be read alongside independent evidence.The latest available ASER 2024, although based on data collected before the UDISE 2025-26 reporting year, remains relevant because it measures learning rather than school infrastructure. It found a strong post-pandemic recovery. Among rural government-school children, the proportion of Class V pupils able to read a Class II-level text rose from 38.5% in 2022 to 44.8% in 2024. Class III reading ability also improved from 16.3% to 23.4%.
This is important positive evidence: government-school learning has recovered substantially after the pandemic. But the same figures expose the remaining problem. Even in 2024, more than half of rural government-school Class V children could not read a Class II-level text.
The significance is larger than the figures themselves. ASER measures children’s actual ability through a household survey, whereas UDISE largely records what happens within the schooling system. Taken together, they show both sides of the picture: India is succeeding in getting children into school, but far too many still do not acquire age-appropriate foundational skills.
The World Bank’s learning-poverty framework makes the same fundamental point: educational success must ultimately be judged by whether children acquire minimum reading comprehension, not merely whether they are enrolled. Enrolment is not learning, and infrastructure is not educational quality.
Digital Divide Has Not Disappeared
UDISE+ reports computers in 69.9% of schools and internet connectivity in 67.4%. Thus, roughly one-third of schools remain without internet.Even these figures do not establish meaningful digital access. They do not tell us whether equipment is functional, whether connectivity is reliable, whether teachers are trained, whether children have devices at home or, more importantly, whether electricity is available when digital facilities are needed.
ASER’s recent evidence shows that although smartphone availability among rural adolescents is extremely high at household level, individual ownership and educational use remain substantially lower. The digital divide is therefore not simply a question of whether a school has an internet connection. It is a question of whether children can actually use technology for learning.
Equality cannot be Measured by Averages
The geographical differences are striking. NITI Aayog’s analysis records very large State-level variations in enrolment, teacher availability and other educational indicators. Such disparities demonstrate why national averages can be misleading.
The same concern applies to disadvantaged communities and children with disabilities. UDISE+ shows that girls constitute 48.4% of enrolment and women 54.9% of teachers, indicating important progress in gender participation. Yet only 58.2% of schools have ramps with handrails, leaving a substantial accessibility gap.
For children from poorer households, SC/ST communities, minorities and remote regions, physical access, transport, teacher availability and family economic circumstances can determine whether enrolment becomes meaningful education. Thus, the question is not simply whether India is progressing, but whether the gains are reaching those who need them most.
There is also a data limitation. UDISE does not provide sufficiently detailed religion-wise public data to assess the educational position of individual religious communities with the same precision available for categories such as SC, ST and OBC. Aggregated minority figures cannot adequately answer questions specifically concerning Muslim educational participation. Better disaggregated data would allow more informed policy and public debate.
Private Coaching: Hidden Cost of Schooling
Another dimension of educational inequality receives comparatively little attention: private coaching.Government survey evidence indicates that nearly one in three school students takes private coaching. This is significant because the formal school system may increasingly coexist with a parallel, privately purchased education system.
If affluent families can supplement ordinary schooling with coaching, digital devices and additional learning resources while poorer families cannot, differences in household income can translate directly into differences in educational outcomes. The real cost of education, therefore, cannot be measured only by school fees. It includes tuition, coaching, transport, devices, books and the opportunity cost of a child’s time.
From Expansion to Equity
India’s education debate often begins and ends with enrolment. But being counted as a student does not necessarily mean receiving a meaningful education. A child may attend school regularly yet struggle to read a simple paragraph or perform basic arithmetic. Another may have a computer in school but no device or internet connection at home. A third may attend a single-teacher school where several grades share one teacher.
The constitutional promise is larger than the expansion of schooling. Article 21A guarantees free and compulsory education for children aged six to 14, while Article 46 requires the State to promote the educational and economic interests of weaker sections. Educational inequality is therefore not merely a development concern; it is also a constitutional one.
India’s next phase must focus on retention, quality, equity and learning outcomes. This requires targeted investment in educationally deprived districts; more equitable teacher deployment; stronger support for children at risk of dropping out; improved access to secondary schools; functional digital facilities; and genuine accessibility for children with disabilities. Policymakers must also investigate why millions of families are moving towards private schools and whether government schools are providing comparable learning opportunities.
The challenge is no longer simply to build more schools, appoint more teachers or enrol more children. It is to ensure that the quality of a child’s education is not determined by the school they happen to attend, the State in which they live or the economic circumstances of their family.
The real test of India’s education system is not how impressive its averages look. It is whether the child at the margins receives the same genuine opportunity to learn as the child at the centre.